Published on
AI in Foot Traffic Analysis: A Retail Leader’s Guide
AI in foot traffic analysis is the application of machine learning, computer vision, and predictive modeling to transform raw sensor and location data into behavioral intelligence that drives staffing, layout, marketing attribution, and real estate decisions. Rather than simply counting heads at a door, these systems interpret why people move the way they do and what will happen next. The practical outputs most teams care about include:
Footfall counts (hourly, daily, zone-level)
Heatmaps showing where visitors concentrate and avoid
Dwell time per zone or product area
Predictive hourly forecasts combining historical patterns with weather and event data
Unique-visitor rates and return-visit frequency
Retailers who connect these signals to point-of-sale (POS) data typically see measurable conversion-rate improvements because they can staff peak windows precisely rather than by intuition. CCPA/CPRA compliance is achievable when systems operate on anonymized, aggregate behavioral signals rather than individual profiles, a distinction that matters enormously for US deployments.
Key Takeaways
AI in foot traffic analysis converts sensor and location data into predictive behavioral intelligence that drives staffing, layout, marketing attribution, and real estate decisions across retail and commercial property portfolios.
Point | Details |
|---|---|
AI adds prediction, not just counting | Combining historical sensor data with weather and event variables produces hourly forecasts that enable proactive staffing and inventory decisions. |
Data cleaning determines KPI quality | Staff exclusion, deduplication windows, and anomaly filtering must be configured before any downstream metric is trustworthy. |
Count accuracy has a ceiling | Computer vision-based counting is commonly claimed at 95%+ under standard conditions; real-world performance depends on lighting, placement, and crowd density. |
Privacy compliance is architectural | Operating on anonymized, aggregate behavioral signals rather than individual profiles supports CCPA/CPRA compliance and reduces legal exposure. |
BRDGIT closes the pilot-to-production gap | BRDGIT’s fractional engineers provide the integration and workflow logic that turns foot traffic data into operational decisions without a full-time AI hire. |
Table of Contents
What does AI actually add to raw foot traffic counts?
How is foot traffic data collected?
What AI methods power foot traffic analysis?
What KPIs should you track from foot traffic AI?
How do retail, real estate, and hospitality teams use foot traffic AI?
What accuracy limits and privacy risks should you plan for?
How is a production foot traffic AI system built?
What should you ask vendors before you buy?
The gap between a working pilot and a production system
BRDGIT helps you move from foot traffic data to real operational decisions
Sources
What does AI actually add to raw foot traffic counts?
Foot traffic, footfall, and visitor signals are not the same thing, though the terms get used interchangeably. Foot traffic refers to the volume of people entering a space. Visitor signals are richer: entry and exit timestamps, movement paths, dwell time in specific zones, and whether a person has visited before. Raw counts from a basic infrared counter tell you how many people walked through a door. AI tells you whether that number is trending toward a staffing gap, a layout problem, or a missed marketing window.
The conceptual pipeline runs: sensors capture raw signals, AI models label and classify those signals (person vs. staff, new vs. returning visitor, browsing vs. transiting), aggregation layers clean and deduplicate the data, and the output layer surfaces insights through dashboards or API feeds. Each stage adds meaning that a simple counter cannot provide.
Common AI outputs include zone-level heatmaps that reveal dead spots in a store layout, unique-visitor tagging that distinguishes a loyal customer from a first-time browser, directional flow maps showing how people navigate between departments, and predictive hourly forecasts that combine historical sensor data with external variables like weather and local events to anticipate busy windows before they arrive.
How is foot traffic data collected?
No single sensor type covers every use case. Most production systems triangulate across two or more sources to balance accuracy, cost, and privacy exposure.
Cameras with computer vision deliver the richest behavioral data: people counts, dwell, direction, and queue length. They require thoughtful placement and lighting, and they carry the highest privacy scrutiny. Computer vision-based people counting is commonly claimed to reach 95%+ accuracy under standard lighting and deployment conditions.

Infrared and thermal counters are lower cost and privacy-safe by design since they detect body heat rather than images. Accuracy degrades in high-density crowds or when people walk side by side.
Wi-Fi and Bluetooth sensors detect device signals from smartphones, giving dwell estimates and return-visit signals without cameras. The limitation is device-level noise: a single shopper carrying two devices registers as two visitors without deduplication logic.
Mobile SDKs and location panels provide off-premise signals, useful for understanding trade-area draw and competitive visit patterns. Accuracy depends heavily on panel size and opt-in rates.
POS and transaction joins are not a collection method on their own, but linking transaction timestamps to visitor counts is what produces conversion rate as a metric rather than a guess.
Turnstiles and building sensors are common in office buildings, transit hubs, and venues where controlled entry points make counting straightforward and accurate.
Source | Typical accuracy | Privacy risk | Integration complexity |
|---|---|---|---|
Camera + computer vision | High (95%+ claimed under standard conditions) | Higher (image data) | Moderate to high |
Infrared/thermal counter | Moderate (degrades in crowds) | Low | Low |
Wi-Fi/Bluetooth | Moderate (requires deduplication) | Moderate | Moderate |
Mobile SDK/location panel | Variable (panel-dependent) | Moderate to high | Moderate |
POS transaction join | N/A (derived metric) | Low | Low to moderate |
Turnstile/building sensor | High (controlled entry) | Low | Low |
What AI methods power foot traffic analysis?
Computer vision is the most data-rich technique. Models trained on overhead or angled camera feeds detect and track silhouettes, count entries and exits, measure time spent in zones, and flag queue buildup. Edge deployment, where inference runs on a device at the camera rather than in the cloud, is the right choice when you need real-time alerts (a queue exceeding five people, for example) or when sending raw video to a cloud server creates unacceptable privacy or bandwidth exposure.
Unique-visitor tagging applies movement logic and re-identification algorithms to assign a consistent anonymous ID to each visitor across a session and across return visits. This is what separates a meaningful conversion rate from a misleading one. Advanced systems apply unique-visitor tagging and movement logic to distinguish returns and staff movement, producing a purified data set that reduces double-counting.
Clustering and segmentation group visitors by behavioral patterns: browsers who spend 12+ minutes in a category, transiting visitors who never pause, and high-dwell returners who convert at twice the average rate. These segments feed layout decisions and targeted marketing.
Predictive analytics models use historical footfall patterns alongside external variables to forecast future volumes. Statistical models (ARIMA, gradient boosting) often suffice for weekly staffing forecasts. Deep learning adds value when the signal is complex, such as multi-location portfolios with heterogeneous traffic patterns.
Pro Tip: Before deploying unique-visitor tagging, define your staff-exclusion logic first. Staff members who spend eight hours on the floor will inflate dwell-time averages and distort zone-occupancy data if not filtered. Most vendors support badge-based or schedule-based exclusion zones; confirm this capability before signing a contract.
What KPIs should you track from foot traffic AI?
Foot traffic KPIs include footfall volume, dwell time, conversion rate, return visits, and inventory turnover, and these metrics form the operational foundation for staffing, layout, and marketing decisions.
Footfall volume: Total entries per period, broken down by hour, day, zone, and location. The baseline metric everything else is indexed against.
Conversion rate: Transactions divided by unique visitors in the same window. Requires a clean POS join and deduplicated visitor counts to be meaningful.
Dwell time: Average minutes a visitor spends in a zone or the full store. High dwell in a product area correlates with purchase intent; high dwell near an exit often signals confusion or checkout friction.
Capture rate: The percentage of people passing the storefront who actually enter. Useful for evaluating window displays, signage, and external promotions.
Return visits: The share of visitors who have been counted before within a defined window (30 days is common). A leading indicator of loyalty and a check on acquisition-heavy marketing spend.
Zone-level occupancy: Real-time and historical headcount per defined area. Feeds safety compliance, layout optimization, and staff deployment.
Queue length: Derived from camera or sensor data at checkout or service points. The most direct input for real-time staffing alerts.
On accuracy: count accuracy varies depending on sensor type, placement, and crowd density. Unique-visitor de-duplication performance varies more widely and depends almost entirely on the quality of the exclusion logic applied during data cleaning.
How do retail, real estate, and hospitality teams use foot traffic AI?
Retail. A mid-size specialty retailer uses hourly footfall forecasts to build rolling staffing schedules, cutting labor hours during low-traffic windows and adding coverage before predicted peaks. AI analytics can integrate foot-traffic signals with inventory and pricing decisions to recommend replenishment, pricing strategies, and store clustering based on behavioral patterns. The result is a tighter link between what visitors do and what the supply chain prepares for. For teams exploring this connection further, AI-powered inventory control is a natural next step.
Real estate and asset valuation. Property owners and REITs use foot traffic data to benchmark tenant performance, support lease negotiations, and assess the trade-area draw of prospective acquisitions. A location with strong capture rate and rising return visits commands a different valuation conversation than one with flat or declining traffic, regardless of what the tenant’s own sales reports say.
Hospitality and venue operations. Hotels, stadiums, and food-service venues use zone-level occupancy and queue data to deploy staff dynamically. AI-driven operational signals enable real-time queue alerts and dynamic staffing adjustments that reduce service wait times without overstaffing. For a deeper look at hospitality-specific applications, AI in hospitality operations covers the operational mechanics in detail.
Marketing attribution. Linking campaign spend to in-store visits closes the loop that digital-only attribution cannot. A retailer running a geo-targeted mobile campaign can measure whether exposed users visited within 72 hours, at what rate compared to a control group, and how long they stayed. That signal feeds trade promotion decisions and budget reallocation in ways that last-click digital attribution never could.
What accuracy limits and privacy risks should you plan for?
Accuracy is not a fixed number. It degrades with occlusion (people blocking each other’s path in front of sensors), poor lighting, suboptimal sensor placement, and staff movement that inflates counts. Legacy sensor hardware often carries high error rates in busy stores; AI-driven computer vision and software filtering reduce those errors significantly, but only when the underlying data pipeline is clean.
Data cleaning is where most teams underinvest. Excluding staff movement, defining deduplication windows (how long before the same device or silhouette is counted again), and handling edge cases like delivery personnel or maintenance workers are decisions that materially affect every downstream KPI. A staffing model built on uncleaned data will be wrong in a systematic, repeatable way.
Physical-store AI analytics operates at an aggregate behavioral level rather than individual-level profiles, which supports privacy-compliant operational decision-making. That architectural choice also simplifies US compliance.
US privacy checklist for foot traffic AI deployments:
Anonymize at the point of capture: no facial recognition, no persistent individual IDs linked to PII
Apply data minimization: retain only the aggregated signals your use case requires
Review vendor SLAs for data retention, deletion rights, and breach notification timelines
Assess CCPA/CPRA implications if your system collects device-level signals from California residents, even indirectly through mobile SDK data
Post clear in-store signage where cameras or sensors are active
Confirm that any third-party data panel you purchase has documented opt-in consent from its participants
How is a production foot traffic AI system built?
Detection accuracy alone is not sufficient; success requires an architectural pipeline that integrates perception data into operational workflows. Here is the sequence that production systems follow:
Data capture: Cameras, sensors, Wi-Fi probes, and mobile SDK feeds generate raw signals at the edge or stream to an ingestion layer.
On-device inference (optional): Edge AI models run people counting and basic classification locally, reducing bandwidth and keeping raw video off the network.
Ingestion and normalization: Raw counts and signals are timestamped, location-tagged, and formatted for downstream processing.
Cleaning and deduplication: Staff exclusion rules, deduplication windows, and anomaly filters run here. This stage determines the quality of every metric downstream.
Feature engineering: Derived features are computed: dwell time, zone transitions, capture rate, return-visit flags, and external variable joins (weather, events, promotions).
Storage: Processed data lands in a time-series or columnar store optimized for the query patterns your dashboards and models need.
Dashboards and APIs: Operational dashboards surface real-time alerts and KPI trends; API endpoints feed staffing systems, BI tools, and marketing platforms.
Edge vs. cloud is a real architectural decision, not a vendor preference. Edge is the right call when you need sub-second latency for queue alerts, when bandwidth to a central server is constrained, or when keeping raw video off the network is a privacy requirement. Cloud is necessary for deep historical analytics, model retraining on large datasets, and portfolio-level comparisons across dozens of locations. Most mature deployments use both: edge for real-time perception, cloud for analytics and forecasting. For teams thinking about how these pipelines connect to broader demand signals, AI in demand forecasting covers the integration logic in detail.
What should you ask vendors before you buy?
Vendor claims about accuracy are almost always measured under ideal conditions. Your job in procurement is to stress-test those claims against your actual environment.
What is your count accuracy methodology, and under what conditions was it measured? Can you provide third-party validation?
How does your system handle staff exclusion, and what configuration is required on our end?
What unique-visitor logic do you use, and what is the expected de-duplication error rate in a high-traffic environment?
Do you support edge deployment, cloud, or both? What are the latency and privacy tradeoffs in your architecture?
What data export formats do you support, and can we connect directly to our POS, BI platform, or staffing system?
What are your SLAs for uptime, data accuracy, and support response time?
How do you handle CCPA/CPRA compliance for any device-level signals in your data pipeline?
What does your pilot scope look like, and what success metrics do you use to recommend moving to production?
Procurement red flags: a vendor who cannot explain their staff-exclusion logic, who quotes accuracy without specifying conditions, or who resists a time-limited pilot before a full contract. A vendor confident in their system will welcome a 60-day pilot with agreed KPIs.
For the pilot itself, define success before you start: a minimum count accuracy threshold (90%+ is a reasonable floor), a conversion rate improvement target tied to a specific staffing or layout change, and a data export test confirming your BI integration works end to end.
The gap between a working pilot and a production system
Most foot traffic AI pilots succeed technically and stall operationally. The sensor counts correctly, the dashboard looks good, and then nothing changes because no one built the workflow that turns a footfall forecast into a staffing schedule or a heatmap into a layout decision. That gap is where most of the business value gets lost, and it is almost never a technology problem.
Industry reporting confirms rapid AI adoption in retail across personalization, forecasting, and operations, with executives expecting measurable uplifts. But expectation and execution are different things. The teams that close the gap share one characteristic: they treat foot traffic as a primary signal in their operational decision loop, not a reporting artifact reviewed after the fact. Foot traffic intelligence can expose acquisition or conversion issues before sales reports surface them, which means the teams acting on it have a structural advantage over those waiting for end-of-week numbers.
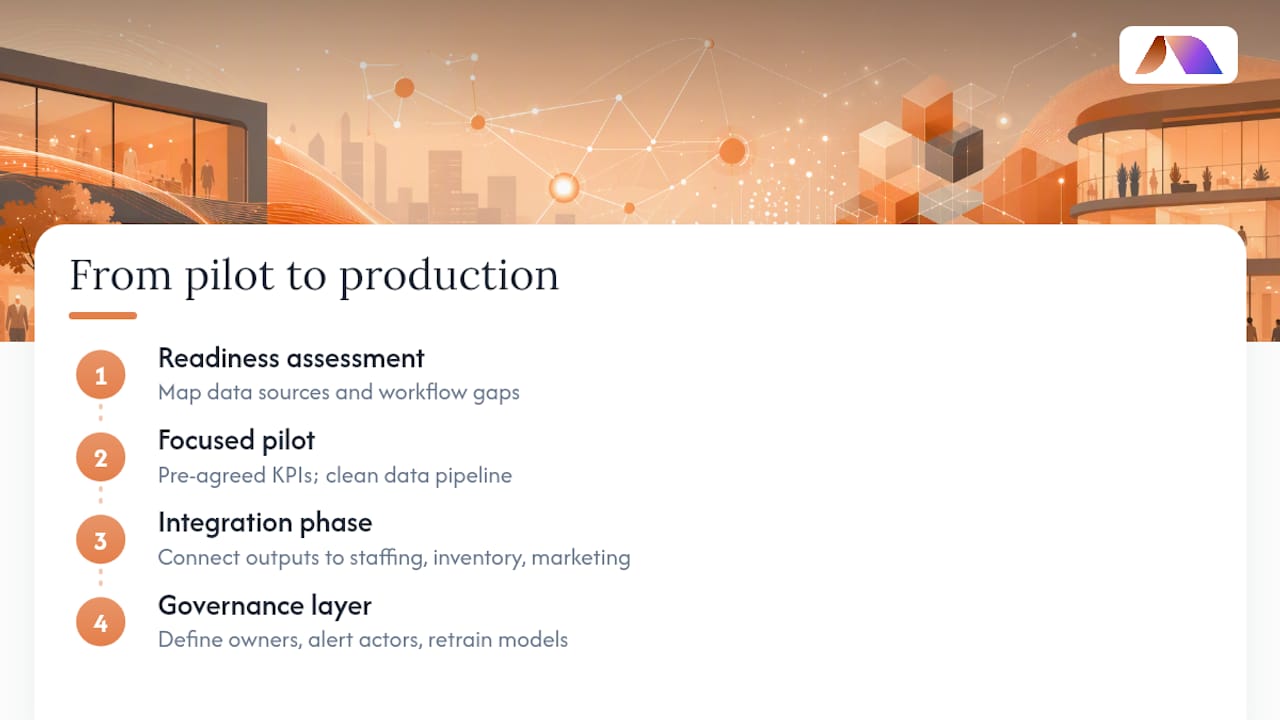
The four steps that actually move a team from pilot to production: a readiness assessment that maps current data sources and workflow gaps, a focused pilot with pre-agreed KPIs and a clean data pipeline, an integration phase that connects foot traffic outputs to staffing, inventory, and marketing systems, and a governance layer that defines who owns the data, who acts on alerts, and how models are retrained as patterns shift. Teams without in-house AI engineering capacity tend to stall at step three. Fractional engineering support, the kind BRDGIT provides, covers exactly that gap without the overhead of a full-time hire.
Pro Tip: For your pilot, choose one location with a controlled entry point, a working POS integration, and at least 90 days of historical data. Define two KPIs before you start, not five. A narrow, well-instrumented pilot produces evidence that moves budgets; a broad, loosely defined one produces a slide deck.
BRDGIT helps you move from foot traffic data to real operational decisions
Most teams already have more data than they are acting on. What they lack is the architecture, the integrations, and the workflow logic that turns a footfall forecast into a staffing schedule or a heatmap into a layout change.
BRDGIT works with retail, real estate, and operations teams to build exactly that path: from AI readiness assessments that identify where your current data pipeline breaks down, through implementation of foot traffic AI systems and dashboard builds, to fractional engineering support that keeps the system running and improving after launch. You do not need a full-time AI team to get this right. BRDGIT’s fractional engineers provide the technical depth to design, integrate, and govern a production foot traffic system on a timeline and budget that fits a mid-sized operation. If you are ready to move from pilot curiosity to a system your operations team actually uses, reach out to BRDGIT for a readiness assessment.
Sources
What Are Real-Time Foot Traffic Metrics? Best Predictive Foot Traffic Datasets 2026 - PassBy
AI-Powered Foot Traffic Analytics Transform Modern Retail | Retail Curated
Retail Foot Traffic Data: How To Track & Use It (2026) - Shopify
Designing an AI Foot Traffic Analysis System for Retail · DEV Community