Published on
How AI Reshapes Retail Customer Segmentation
AI automates, continuously refines, and operationalizes retail customer segments by converting first-party transaction data, behavioral signals, and loyalty records into execution-ready audiences that update in near real time. The role of AI in retail customer segmentation is not an incremental improvement over spreadsheet-based RFM lists. It is a structural shift: AI-driven segmentation consistently outperforms static, rules-based methods and supports measurable marketing uplifts across conversion, margin, and customer lifetime value.
The immediate business impact for U.S. retail teams:
Higher LTV: Predictive segments surface high-value customers before they churn, enabling proactive retention spend.
Lower CAC: Suppressing already-converted or low-propensity customers from paid acquisition reduces wasted impressions.
Reduced promo waste: Restricting discounts to genuinely promo-sensitive segments protects margin on customers who would have bought at full price.
Real-time activation: Segments sync to email, paid media, and in-store POS systems within hours, not weeks.
Your first step this week: Pull your last 12 months of POS and e-commerce transaction data, map it to a single customer identifier, and calculate recency, frequency, and monetary value (RFM) scores. That baseline is the foundation every AI model will build on.
Key Takeaways
AI-driven retail customer segmentation delivers measurable gains in LTV, CAC, and margin when it is built on a clean identity spine, validated with both cluster quality metrics and business holdouts, and activated through a governed, channel-connected stack.
Point | Details |
|---|---|
Start with RFM and a clean identity spine | Baseline K-Means on recency, frequency, and monetary value before adding model complexity. |
Validate with Silhouette Score and Davies-Bouldin Index | Target a Silhouette Score above 0.7 and a Davies-Bouldin Index below 0.5 before activating any segment. |
Restrict promos to promo-sensitive segments | Uplift modeling protects margin by keeping full-price buyers out of discount campaigns. |
Govern segments before you scale | Assign named owners, set minimum population sizes of 500+, and schedule quarterly model retraining. |
BRDGIT accelerates pilots without a full-time hire | Fractional AI engineering delivers the identity, model, and activation work in 8–12 weeks with a documented handoff. |
Table of Contents
How does AI customer segmentation work in retail?
Which algorithms and approaches work best for retail segmentation?
How do you implement AI segmentation step by step?
How do you measure segmentation quality and business impact?
How do you activate AI segments across channels?
What retail campaigns benefit most from AI segmentation?
What are the biggest pitfalls in AI segmentation and how do you avoid them?
Which tools and platforms support AI segmentation in U.S. retail?
A 6-step pilot blueprint you can run in 8 to 12 weeks
U.S. retail market context: regulations and consumer behavior
U.S. retail case studies in AI-driven segmentation
How should data science, marketing, and sales teams collaborate on segmentation?
What does AI segmentation actually cost to implement?
What we have learned from real implementations
BRDGIT helps retail teams move from segmentation theory to working systems
Sources
How does AI customer segmentation work in retail?
AI segmentation starts with data unification and ends with scored, labeled audiences sitting inside your activation stack. The path between those two points involves four distinct phases.
Data inputs are broader than most teams initially assume. Point-of-sale transactions, e-commerce order histories, browse and cart-abandonment events, loyalty program activity, return logs, customer service interactions, and even inventory and promotional context all feed the model. Shopify’s practitioner guidance stresses data unification as a prerequisite before any model-building begins, and that holds whether you run a single DTC storefront or a multi-banner retail chain. For wholesale-adjacent retail, RFM tailoring combined with firmographic enrichment adds another layer of signal that pure behavioral models miss.
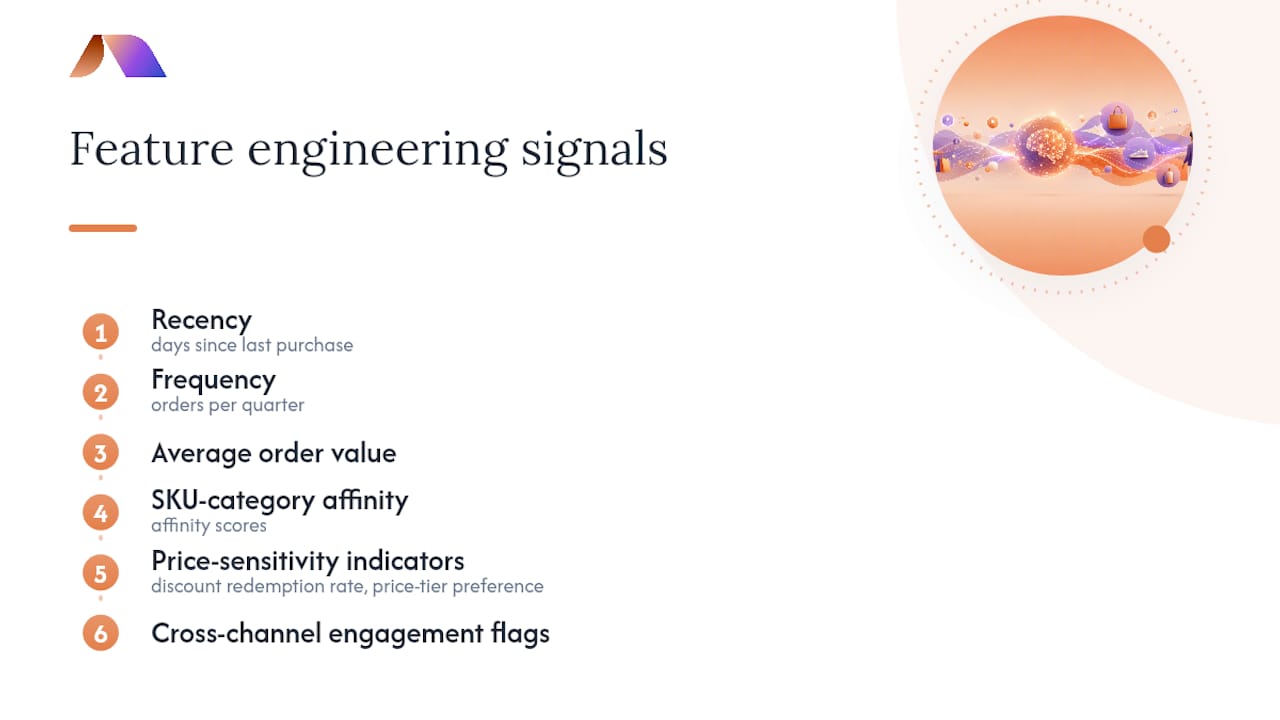
Feature engineering is where raw transactions become model-ready signals. Recency (days since last purchase), frequency (orders per quarter), average order value, SKU-category affinity scores, price-sensitivity indicators (discount redemption rate, price-tier preference), and cross-channel engagement flags are the most predictive features in most retail datasets. Sequence features, such as the order in which product categories were first purchased, add meaningful lift for replenishment and cross-sell models.
The model lifecycle runs continuously, not in quarterly batches. Models are trained on historical data, then deployed to score every customer profile on a defined cadence. Scores feed into a CDP or data warehouse, which syncs segment membership to downstream activation systems. Identity resolution, matching email addresses, loyalty IDs, device identifiers, and in-store card swipes to a single profile, sits at the center of this loop. Without a clean identity spine, the same person appears in multiple segments simultaneously, and your activation logic collapses.
Update cadence depends on use case. Churn-risk scores for a win-back email sequence can tolerate daily or micro-batch updates. A real-time product recommendation engine at checkout needs sub-second inference. Most mid-market retail teams operate somewhere in between: hourly or four-times-daily syncs that balance freshness with infrastructure cost.
Which algorithms and approaches work best for retail segmentation?
Practitioners have three broad families to choose from, and the right answer usually involves combining them rather than picking one.
Unsupervised clustering
K-Means remains the workhorse for initial segmentation because it is fast, interpretable, and produces stable cluster assignments that non-technical stakeholders can act on. DBSCAN handles irregular cluster shapes and naturally identifies outliers, making it useful for detecting anomalous purchase patterns without forcing every customer into a predefined bucket. Hierarchical clustering works well when you need a dendrogram to explain segment relationships to leadership, though it scales poorly beyond a few hundred thousand customers.
Hybrid AI-clustering
Raw K-Means has a known weakness: centroid initialization is random, so results vary across runs. A 2025 peer-reviewed study found that AI enhancements to K-Means, including automated centroid initialization and neural optimization, produced a Silhouette Score of 0.87 and a Davies-Bouldin Index of 0.15 on a simulated retail dataset, identifying manager-meaningful segments such as “active digital spenders” and “conservative mature shoppers.” Those numbers represent high cluster quality: a Silhouette Score approaching 1.0 means clusters are dense and well-separated, while a Davies-Bouldin Index near 0 means clusters are compact relative to the distance between them. Hybrid methods also improve stability across re-runs, which matters when segment definitions drive budget allocation decisions.
Supervised and predictive approaches
When the segment you care about is defined by a future behavior rather than a past pattern, supervised models take over. Churn probability, reorder propensity, and next-category purchase likelihood are all classification problems. Combining Random Forest classifiers with K-Means clustering adds actionable labels to spending-pattern clusters, letting you answer both “who are these customers?” and “what will they do next?” in a single pipeline. AI-based clustering frameworks improve marketing decision support precisely because they layer predictive labels onto descriptive clusters.
Representation learning and embeddings
For retailers with large SKU catalogs and rich browse histories, product embeddings trained on co-purchase sequences capture affinity relationships that frequency counts miss entirely. A customer who buys running shoes and then browses compression socks is signaling a different need than one who buys the same shoes alongside casual apparel. Sequence models like recurrent neural networks or transformer-based architectures can encode that temporal pattern into a dense vector that feeds downstream clustering or ranking models.
Trade-offs to keep in mind: interpretability decreases as model complexity increases. K-Means segments can be described in a sentence. An embedding-based cluster requires a data scientist to explain. Match the method to the audience who will act on the output.
Approach | Best for | Interpretability | Latency fit | Data scale needed |
|---|---|---|---|---|
K-Means | Baseline RFM-style segments | High | Batch | Low to medium |
DBSCAN | Outlier detection, irregular shapes | Medium | Batch | Medium |
Hybrid AI-K-Means | Stable, manager-ready segments | High | Batch/micro-batch | Medium |
Random Forest + clustering | Predictive labels on descriptive clusters | Medium | Batch | Medium to high |
Product embeddings + clustering | SKU affinity, cross-sell discovery | Low | Batch | High |
Sequence models | Replenishment, next-category prediction | Low | Real-time capable | High |
Pro Tip: Start with a hybrid K-Means baseline before investing in embeddings. If the business KPIs from three well-defined clusters do not move the needle, the problem is usually activation or governance, not model sophistication.
How do you implement AI segmentation step by step?
A disciplined implementation prevents the most common failure mode: a technically impressive model that never reaches a marketing channel.
Data discovery and mapping. Audit every first-party data source: POS systems, e-commerce platform, loyalty database, CRM, and returns log. Map each source to a common customer identifier. Flag gaps, particularly missing email-to-loyalty linkages and anonymous browse sessions that never converted to a known ID.
Preprocessing and identity resolution. Build a hashed ID spine that links all known identifiers for each customer. Apply feature scaling (standardize continuous variables, encode categoricals). Handle missing values through median imputation for numeric features and a dedicated “unknown” category for categorical ones. Document every transformation so the pipeline is reproducible.
Baseline model and experiment plan. Train a standard RFM-based K-Means model as your baseline. Define three to five candidate segment counts (k=3 through k=7) and evaluate each using Silhouette Score and Davies-Bouldin Index. This baseline gives you a performance floor and a business narrative before you introduce complexity.
Validation: cluster quality and business holdout. Score cluster quality with the metrics above, then design a holdout experiment. Randomly assign 20% of each segment to a control group that receives the current default treatment. The remaining 80% receives the AI-driven personalized treatment. Run for four to six weeks before drawing conclusions.
Deployment and orchestration. Write scored segment membership to your CDP or data warehouse on a defined cadence. Configure sync jobs to downstream activation destinations: email platform, paid media audiences, in-store POS loyalty system. Build suppression lists for customers in active win-back flows or recent purchasers who should not receive acquisition messaging. Log every sync with timestamps and record counts for audit purposes.
Governance and roles. Assign a segment owner in marketing who approves any change to segment definitions. Assign a data engineer who owns the pipeline and monitors for drift. Schedule a monthly review of segment population sizes and stability. Any segment that loses or gains more than 30% of its population in a single scoring cycle warrants investigation before the next activation.
How do you measure segmentation quality and business impact?
Technical metrics and business KPIs answer different questions. You need both.
Cluster quality metrics
The Silhouette Score measures how similar a customer is to their own cluster compared to the nearest neighboring cluster. Scores range from -1 to 1; values above 0.5 indicate reasonable separation, and values above 0.7 indicate strong cluster structure. The Davies-Bouldin Index measures the average ratio of within-cluster scatter to between-cluster distance. Lower is better; values below 0.5 are generally considered strong. The 2025 hybrid K-Means study reported a Silhouette Score of 0.87 and a Davies-Bouldin Index of 0.15, which represents a high-quality result worth benchmarking against.
Operational validation adds a third check: stability. Track the week-over-week churn rate between segments and enforce minimum population sizes. A segment with fewer than 500 customers rarely justifies the operational overhead of a dedicated campaign.
Business KPIs
Conversion uplift (treatment vs. control), incremental revenue per customer, margin impact (especially when promo discounts are involved), CLV trajectory over 90 and 180 days, and CAC reduction in paid acquisition are the metrics that justify continued investment. AI-driven segmentation that reduces promo waste and improves margin outcomes is the clearest business case for most U.S. retail teams, because the cost of unnecessary discounting is immediately visible in gross margin reports.
Statistic to anchor your business case: Shopify’s practitioner data points to up to ~15% revenue growth in some AI-driven personalization cases, though results vary significantly by retailer size, category, and activation discipline.
Geo tests and uplift modeling work well when user-level randomization is not feasible, such as in-store promotions or TV-adjacent campaigns. Marketing mix modeling (MMM) provides a longer-horizon view when digital attribution is incomplete.
Pro Tip: Never report only cluster quality metrics to a marketing leadership team. Translate Silhouette Score improvements into “we reduced the number of customers receiving irrelevant promotions by X%” to make the technical work legible to budget holders.
How do you activate AI segments across channels?
Segments sitting in a data warehouse are hypotheses. Segments synced to your activation stack are revenue.
The standard activation path runs: CDP (identity resolution and segment storage) → marketing automation platform (email, SMS, push) → paid media audiences (Google, Meta, retail media networks) → in-store POS or loyalty system. Each handoff introduces latency and potential data loss, so mapping the full path before deployment prevents surprises.
Real-time vs. batch activation is a practical decision, not a philosophical one. Email campaigns tolerate daily batch syncs. Paid media audience updates typically propagate within a few hours of upload. In-store personalization at the point of sale, such as a loyalty app prompt or a staff-facing customer card, can require near-real-time scoring if the use case is triggered by a live transaction.
Privacy and channel constraints shape activation logic as much as the model does. Frequency caps prevent over-messaging high-value segments. Suppression lists keep recently converted customers out of acquisition audiences. Consent-state flags, particularly for SMS and email under CAN-SPAM and state-level privacy laws, must be checked at the point of activation, not just at data ingestion. Writing segment memberships into governed CDPs with audit trails is the operational practice that keeps compliance reviewers satisfied and activation teams moving fast.
For personalized customer experiences to actually land, the segment definition, the message, and the channel must be aligned.
What retail campaigns benefit most from AI segmentation?
Promotional targeting is where the ROI case is clearest and fastest to prove. Uplift modeling identifies which customers respond to a discount versus which ones would have purchased at full price. Restricting promotional spend to the genuinely promo-sensitive segment protects margin without sacrificing volume. This connects directly to AI-driven trade promotion strategies that CPG and retail teams are deploying at scale.

Replenishment nudges use predicted reorder windows to trigger timely messages before a customer runs out of a consumable product. The model learns from historical purchase intervals and adjusts for seasonal variation. A customer who buys coffee pods every 28 days gets a reminder on day 25. The lift in repeat purchase rate from this single use case often justifies the entire segmentation infrastructure investment.
Churn prevention and win-back automation work on opposite ends of the same problem. Churn-risk scores trigger a retention sequence before the customer goes silent. Win-back sequences activate after a defined period of inactivity, with message content and offer depth calibrated to the customer’s historical value tier.
In-store personalization: Loyalty app integrations surface cross-sell recommendations and segment-specific offers at the point of scan, giving store associates context they would not otherwise have.
Retail media and paid activation: Syncing AI segments to retail media networks requires in-stock gating (do not advertise a product that is out of stock in the customer’s nearest store) and negative audience suppression (exclude recent purchasers from acquisition campaigns). AI-powered order fulfillment signals feed directly into this eligibility logic.
Dynamic pricing: Price-sensitivity segments inform which customers see promotional pricing versus full-price presentation, connecting segmentation directly to AI-driven retail pricing strategy.
What are the biggest pitfalls in AI segmentation and how do you avoid them?
Data quality is the most common failure point, and it is rarely dramatic. Sparse SKU-level purchase histories for infrequent buyers, missing loyalty-to-email linkages, and noisy web event data from bot traffic or session stitching errors all degrade model quality quietly.
Bias and fairness deserve explicit attention in U.S. retail. If your training data reflects historical marketing decisions that underserved certain zip codes or demographic groups, the model will learn and amplify those patterns. Test segment distributions against demographic proxies (zip code income level, geographic region) and remove protected attributes from feature sets entirely. Explainability tools like SHAP values help identify which features are driving segment assignments, making it possible to catch proxy discrimination before it reaches a campaign.
Privacy and CCPA compliance require a consent-first identity architecture. California’s Consumer Privacy Act gives residents the right to opt out of the sale or sharing of their personal information, and several other U.S. states have enacted similar frameworks. Segment membership derived from behavioral data is subject to these rules when it is shared with third-party ad platforms. Suppression lists must be updated in near real time, and consent-state flags must travel with the customer record through every system in the activation stack.
Operational risk takes three forms in practice. Segment drift occurs when the underlying customer behavior shifts but the model is not retrained frequently enough to reflect it. Overfitting microsegments creates hundreds of tiny audiences that are statistically interesting but operationally unmanageable. Promotional cannibalization happens when too many segments receive overlapping discount offers, eroding the margin gains the segmentation was supposed to protect. Minimum segment size guardrails (500 customers as a floor), quarterly model retraining schedules, and a segment rationalization review every six months address all three.
Which tools and platforms support AI segmentation in U.S. retail?
The market organizes into four platform categories, each solving a different part of the problem.
Customer data platforms (CDPs) handle identity resolution, profile unification, and segment storage. Twilio Segment is the most widely deployed CDP in U.S. mid-market retail, valued for its extensive connector library and its ability to pipe unified customer profiles to virtually any downstream activation destination. Salesforce CDP (now part of Salesforce Data Cloud) serves enterprise retailers that need tight integration with Salesforce Marketing Cloud, Commerce Cloud, and Service Cloud, with AI-powered segment suggestions built into the interface.
ML platforms and feature stores manage the model training, feature computation, and scoring infrastructure. Teams that have outgrown spreadsheet-based analysis often start with cloud-native options on AWS SageMaker, Google Vertex AI, or Azure ML before investing in a dedicated feature store.
Orchestration and marketing automation tools translate segment membership into triggered campaigns. These range from email service providers with basic segmentation to full marketing automation platforms that support multi-step journeys, frequency capping, and real-time decisioning.
Shopify’s ecosystem deserves specific mention for DTC and mid-market merchants. Shopify Sidekick and the broader Shopify analytics suite give merchants behavioral, value, predictive, and channel-preference segment types out of the box, with direct activation into Shopify Email and third-party integrations. For merchants already on Shopify, this is often the fastest path to a working segmentation workflow.
When evaluating any platform, the dimensions that matter most are: real-time segmentation capability, the breadth of data sources the platform ingests natively, integration surface with your existing CRM and ad platforms, explainability of segment assignments, and total cost of ownership including integration engineering. License cost is rarely the largest line item; integration and ongoing engineering time usually are. That cost calculus is exactly where fractional AI engineering support, rather than a full-time hire, often delivers the better return.
For analysts who need to run quick feature engineering and baseline models before committing to a platform, AI-assisted Excel sales analysis provides a practical starting point that requires no new infrastructure.
A 6-step pilot blueprint you can run in 8 to 12 weeks
This blueprint is designed for a marketing plus analytics team that wants a defensible result, not just a demo.
Weeks 1–2: Scoping and data inventory. Define two or three high-impact business questions (e.g., “Which customers are at churn risk in the next 60 days?”). Audit available data sources, document identifier coverage, and confirm consent-state flags are accessible. Deliverable: a data readiness memo with gap analysis.
Weeks 3–4: Feature build and baseline segmentation. Compute RFM features and two or three additional signals (category affinity, discount redemption rate). Train a K-Means baseline with k=3 through k=5. Score and label segments. Deliverable: segment profiles with population sizes and descriptive statistics.
Weeks 5–6: Model selection and holdout design. Evaluate hybrid AI-K-Means and one supervised model (churn classifier or reorder propensity). Select the model that best balances cluster quality metrics and business interpretability. Design the holdout: randomly assign 20% of each segment to a control group. Deliverable: model selection rationale and experiment protocol.
Weeks 7–8: Activation wiring to one channel. Sync segment membership to a single activation destination (email platform is the lowest-friction starting point). Configure triggered campaigns for each segment. Confirm suppression lists are active. Deliverable: live campaign with control group in place.
Weeks 9–10: Measurement and iteration. Read conversion uplift, revenue per customer, and margin impact against the control group. Identify the one segment delivering the clearest lift and the one underperforming. Adjust features or segment boundaries for the underperformer. Deliverable: interim results report with iteration recommendations.
Weeks 11–12: Scale and governance handoff. Expand activation to a second channel. Document segment definitions, ownership, and monitoring cadence. Hand off the pipeline to the data engineering team with a runbook. Deliverable: governance documentation and a go/no-go recommendation for full deployment.
Role matrix for the pilot:
Marketing owner: defines business questions, approves segment labels, owns campaign execution.
Data engineer: builds and maintains the feature pipeline and sync jobs.
Data scientist: trains and evaluates models, designs the holdout experiment.
Privacy/compliance reviewer: validates consent-state logic and suppression lists before activation.
Fractional AI engineer (BRDGIT): accelerates model selection, integration architecture, and governance documentation without requiring a full-time hire.
U.S. retail market context: regulations and consumer behavior
The U.S. retail environment adds specific constraints that generic segmentation frameworks do not address.
Regulatory environment. California’s CCPA and its amendment, the CPRA, set the most stringent data rights framework in the country, but Virginia (VCDPA), Colorado (CPA), Connecticut (CTDPA), and a growing list of other states have enacted their own consumer privacy laws. For a national retailer, the practical approach is to build to the most restrictive standard (California) and apply it uniformly, rather than maintaining state-by-state consent logic. The FTC’s enforcement posture on algorithmic systems and data practices is also tightening, making explainability and audit trails a compliance requirement, not just a best practice.
Consumer behavior nuances. U.S. shoppers exhibit strong channel-switching behavior: a customer might research on mobile, purchase in-store, and return via e-commerce. Identity resolution that fails to stitch these touchpoints together produces fragmented segment assignments. Loyalty program participation rates vary sharply by retail category, with grocery and drug retail seeing much higher enrollment than specialty apparel, which affects the coverage of your first-party identity spine. Seasonal concentration (Q4 holiday, back-to-school, and summer outdoor) means that models trained on full-year data can underweight the behavioral patterns that matter most during peak periods. Training separate seasonal models or weighting recent data more heavily addresses this.
Omnichannel complexity is a structural feature of U.S. retail, not an edge case. Buy-online-pick-up-in-store (BOPIS) transactions, curbside returns, and in-store digital kiosk interactions all generate signals that need to flow back into the segmentation model to maintain accuracy. Retailers that treat their e-commerce and physical store data as separate systems will consistently produce worse segments than those that unify them.
U.S. retail case studies in AI-driven segmentation
Grocery and CPG replenishment. A regional U.S. grocery chain applied predictive reorder models to its loyalty database, identifying customers whose purchase intervals for staple categories (dairy, household cleaning, coffee) were approaching their historical reorder window. Triggered email reminders sent three days before the predicted reorder date produced measurable lift in repeat visit frequency and basket size, with the clearest gains in the 35-to-55 age cohort that had the most consistent purchase histories.
Specialty apparel churn prevention. A mid-market specialty apparel retailer used a churn-risk classifier trained on 18 months of transaction data to identify customers who had not purchased in 90 days but whose historical value placed them in the top two LTV quintiles. A tiered win-back sequence, with offer depth calibrated to LTV tier rather than applied uniformly, recovered a meaningful share of lapsed customers at a lower discount cost than the retailer’s previous blanket reactivation campaigns.
DTC brand promotional targeting. A direct-to-consumer brand selling personal care products used uplift modeling to separate its customer base into “discount-motivated,” “full-price loyal,” and “price-indifferent” segments. Restricting promotional emails to the discount-motivated segment while sending full-price messaging to the other two produced a net margin improvement on promotional campaigns, because the brand stopped training its best customers to wait for a sale.
These examples reflect patterns documented across AI-driven retail ROI research and practitioner implementations. The specific lift figures vary by retailer, but the directional outcomes, better margin on promotions, higher repeat purchase rates, and lower win-back costs, are consistent.
How should data science, marketing, and sales teams collaborate on segmentation?
The technical quality of a segmentation model is rarely the binding constraint on business outcomes. Organizational alignment is. Teams that treat segmentation as a data science deliverable handed over to marketing consistently underperform teams that build it as a shared artifact.
Shared vocabulary is the first requirement. Data scientists speak in Silhouette Scores and feature importance. Marketing teams speak in personas and campaign briefs. Sales teams speak in pipeline stages and account tiers. A segment definition document that translates between all three, with a plain-language description, a technical specification, and a campaign application example, prevents the most common miscommunication: marketing activating a segment in a way the model was not designed to support.
Joint sprint reviews at weeks four and eight of a pilot keep all three functions aligned on what the data is showing and what the next activation decision should be. These are not status updates. They are working sessions where marketing reviews segment profiles and flags any that do not match their operational reality, and data scientists explain why the model produced the boundaries it did.
Sales team integration is underutilized in most retail segmentation projects. In B2B-adjacent retail (wholesale distributors, trade accounts, key account management), sales teams hold relationship context that no transaction database captures. A customer flagged as churn risk by the model might be in active negotiation for a larger contract. A feedback loop from sales into the model’s suppression logic prevents the embarrassment of a win-back email landing in the inbox of a customer whose account manager spoke to them yesterday.
Governance ownership must be explicit. Assign a named segment owner in marketing, a named pipeline owner in data engineering, and a named compliance reviewer. Ambiguous ownership is how segments drift unnoticed for six months and how a consent-state error reaches 200,000 customers before anyone catches it.
AI digital marketing strategies that drive real ROI consistently point to cross-functional alignment as the differentiator between teams that get incremental gains and teams that achieve structural improvements in CAC and LTV.
What does AI segmentation actually cost to implement?
Cost estimation is the question most vendors avoid answering directly, so here is a realistic breakdown for U.S. retail teams.
Platform licensing for a CDP ranges from roughly $1,000 to $5,000 per month for mid-market retailers, scaling with data volume and destination connectors. ML platform costs on major cloud providers are consumption-based and typically run $500 to $3,000 per month for a mid-market segmentation workload, depending on training frequency and scoring volume. Marketing automation platforms with segmentation capabilities vary widely, from low hundreds to several thousand dollars monthly.
Integration and engineering is where budgets most often exceed initial estimates. Connecting a CDP to three or four activation destinations, building a feature pipeline from POS and e-commerce sources, and configuring the holdout experiment infrastructure typically requires 200 to 400 hours of engineering time. At market rates for a senior data engineer in the U.S., that is a $40,000 to $80,000 project cost before any ongoing maintenance.
Ongoing maintenance includes model retraining (quarterly at minimum), pipeline monitoring, segment drift reviews, and compliance audits. A dedicated internal data scientist running this alongside other responsibilities is realistic for a mature implementation. Getting to that maturity point, however, usually requires specialized expertise that most retail teams do not have in-house.
The fractional alternative is worth serious consideration for teams that need to move quickly without a full-time hire. A fractional AI engineer engaged for 20 hours per week over a 12-week pilot costs a fraction of a full-time senior hire, delivers the specialized expertise the project needs, and exits cleanly with a documented, maintainable system. That model is specifically what BRDGIT’s fractional engineering engagements are designed to provide.
What we have learned from real implementations
The irony that shows up most often in AI segmentation projects is this: teams that invest the most in model sophistication tend to see the worst early results, while teams that start with three well-defined, operationally simple segments and obsess over activation discipline tend to see the fastest ROI. The model is rarely the bottleneck. The bottleneck is almost always the identity spine, the activation wiring, or the organizational clarity about who owns what.
Microsegments are seductive. A model that produces 47 distinct customer clusters feels like a technical achievement. But 47 segments means 47 campaign briefs, 47 suppression logic configurations, and 47 monitoring jobs. Most marketing teams can execute against five to seven segments with genuine discipline. Beyond that, operational complexity compounds faster than incremental lift.
The governance lesson is equally consistent: teams that define segment ownership, minimum population sizes, and retraining schedules before the first campaign launches avoid the drift and compliance problems that derail projects six months in. Governance is not a constraint on speed. It is what makes speed sustainable.
Fractional AI engineering support, the model BRDGIT operates on, accelerates pilots precisely because it brings implementation pattern recognition that an internal team building its first segmentation system does not yet have. The value is not just the technical work. It is the judgment about which shortcuts are safe and which ones create technical debt that takes months to unwind.
BRDGIT helps retail teams move from segmentation theory to working systems
Most retail marketing teams know what AI segmentation should do. The gap is in execution: the identity spine that needs cleaning, the feature pipeline that needs building, the holdout experiment that needs designing before the first campaign launches.
BRDGIT’s fractional AI engineers work alongside your marketing and data teams to close that gap without a full-time hire. An engagement typically starts with an AI readiness assessment that maps your current data sources, identifies the highest-impact segmentation use cases, and scopes the integration work honestly. From there, BRDGIT can own the model build, the CDP wiring, the governance documentation, and the measurement framework, or support your internal team on the pieces where specialized expertise is the constraint. Pilots typically reach a measurable result in 8 to 12 weeks. The system that comes out of it is yours to run. Talk to a BRDGIT fractional engineer about what your segmentation pilot could look like.
Sources
The sources below cover the technical, business, and governance dimensions of AI segmentation in retail. Consult them in the order that matches your current priority.
For business case and practitioner framing: The SSRN review of AI-driven segmentation in retail synthesizes academic and practitioner evidence on performance versus static methods. Shopify’s AI customer segmentation guide is the most accessible practitioner reference for behavioral, value, predictive, and channel-preference segment types.
AI‑Based K‑Means hybrid models for retail customer segmentation (2025)
ML classification and clustering for customer analysis (2025)