Published on
Trace First LLM Observability: 8 Steps for Engineers
LLM observability is the practice of instrumenting AI applications so every output can be traced back to the prompt, retrieval, and tool call that produced it. It matters because large language models fail silently, generating fluent, confident answers that are wrong, ungrounded, or unsafe with no error thrown. Done right, observability catches those failures before customers do, keeps token costs visible, and turns debugging from guesswork into evidence. The rest of this guide covers the signals to track, how to instrument traces, and how to build the evaluation and alerting pipeline around them.
TL;DR:
Tracking semantic signals such as relevance, groundedness, and safety scores is essential alongside traditional latency and cost metrics to detect silent failures.
Instrumenting comprehensive traces for each user interaction, including model version, prompts, tool calls, and retrieval details, enables fast root-cause diagnosis.
Establishing clear goals, SLAs, and appropriate retention policies before deployment helps balance cost, privacy, and debugging needs.
Tagging traces with specific versioning information allows for early detection of regressions related to model or prompt updates.
Building evaluation scores into alerting and guardrails ensures that quality issues are addressed proactively rather than detected reactively through customer complaints.
BRDGITPut AI Execution on Clearer GroundBRDGIT helps teams identify AI opportunities, build practical roadmaps, and create custom systems with ongoing support.Explore BRDGIT
Table of Contents
What Is LLM Observability, and How Does It Differ From APM?
Why Silent Failures Make LLM Observability Non-Negotiable
Which LLM Performance Metrics Actually Matter?
How Do You Instrument Traces for LLM Applications?
How Do You Evaluate LLM Output Quality at Scale?
Your Implementation Checklist: From Zero to Operational
BRDGIT’s Perspective: Observability as Part of the Delivery Roadmap
Connecting LLM Observability to Existing MLOps Platforms
Data Privacy and Compliance in LLM Observability
Managing Model Updates and Versioning in Your Observability Setup
Real-World Patterns in LLM Observability Implementation
The Engineer’s Take: What Actually Matters Here
Sources
What Is LLM Observability, and How Does It Differ From APM?
Traditional application performance monitoring was built for deterministic systems. A function either throws an exception or it doesn’t; a database query either times out or returns rows. LLM outputs don’t work that way. The same prompt can produce ten different completions, and nine of them might be fine while one quietly invents a fact or ignores an instruction. Standard APM tools have no visibility into that failure mode because they were never asked to judge whether an answer is true, only whether the request succeeded.
That gap is why LLM observability extends traditional monitoring with semantic signals, layered across three distinct planes:
Computational layer: latency, throughput, token counts, and infrastructure cost, the metrics classic APM already handles well.
Semantic layer: relevance, groundedness, factual accuracy, and toxicity, the quality dimensions that only exist because the output is language, not a status code.
Agentic layer: tool-call sequences, loop iterations, and task completion when the LLM is orchestrating multi-step workflows rather than answering a single question.
The unit of debugging in this world is the trace, not the log line. A single user request might fan out into a retrieval call, two tool invocations, and a final generation step, and each of those needs its own span with its own metadata. This is often described with the MELT model, metrics, events, logs, and traces, which gives engineers a shared vocabulary for what “full observability” actually includes. Metrics tell you something is wrong; traces tell you where and why. Without both, teams end up staring at an aggregate latency graph with no way to explain the one request that took 40 seconds or returned nonsense.
Why Silent Failures Make LLM Observability Non-Negotiable
That’s the uncomfortable truth conventional monitoring dashboards hide. A chatbot can answer every query, pass every health check, and still be fabricating product specifications, leaking a customer’s data into an unrelated response, or looping a research agent through the same three tool calls until the token bill triples.
These failure modes have real consequences:
A support bot that hallucinates a return policy creates a legal and customer-trust problem, not a technical ticket.
An agent stuck in a retrieval loop can burn through a monthly token budget in an afternoon with zero user-facing errors.
A retrieval-augmented system pulling stale or irrelevant documents degrades answer quality gradually, often invisible until a customer complains publicly.
Traditional APM lacks visibility into these semantic failures because nothing in the stack actually reads the output and asks whether it’s correct. Observability closes that gap by attaching evaluation scores and cost data directly to the trace that generated them, so when something goes wrong, the mean time to identify the cause drops from hours of log archaeology to a single trace lookup. That shift, from reactive incident response to a searchable record of every decision the model made, is the entire value proposition.
Which LLM Performance Metrics Actually Matter?
Not every metric deserves a dashboard tile. The useful ones split cleanly into the same three families introduced above, and each family answers a different operational question: is it fast enough, is it right, and is it doing what it was told to do.
Computational metrics answer the speed and cost question. Precise definitions matter here: time to first token (TTFT) measures perceived responsiveness, inter-token latency captures streaming smoothness, and end-to-end latency covers the full round trip. Tokens per second and requests per second describe throughput under load. Cost per request, broken down by input and output tokens, is the metric finance teams will eventually ask for, so build it early rather than retrofitting it.
Semantic metrics answer the quality question, and they’re where most teams under-invest. Groundedness checks whether a RAG response is actually supported by the retrieved documents. Relevance checks whether the answer addresses the question asked. Toxicity and PII leakage are binary safety gates. Splunk’s monitoring guidance also recommends tracking perplexity and factuality alongside explicit user feedback, thumbs up or down, correction rate, escalation to a human agent, since subjective quality often needs a human signal to validate what an automated score suggests.
Agentic metrics answer the orchestration question: how many tool calls did this task take, did the agent loop, and what did the full task cost end to end rather than per turn. A single user request routed through an agent might trigger five model calls; tracking cost per completed task, not per call, is what actually maps to a P&L line.
Metric family | Example metrics | Primary question answered |
|---|---|---|
Computational | TTFT, e2e latency, tokens/sec, cost per request | Is it fast and affordable? |
Semantic | Groundedness, relevance, toxicity, user feedback | Is the output correct and safe? |
Agentic | Tool-call count, loop iterations, task-level cost | Is the workflow behaving as designed? |
For aggregation, resist the urge to report only averages. Latency in particular should be reported at the p50, p95, and p99 percentiles, because a mean latency of 800 milliseconds can hide a p99 of 12 seconds that’s driving your abandonment rate. Set anomaly baselines per metric family separately: a spike in token cost with flat latency points to a prompt or retrieval problem, while rising latency with flat cost usually points to infrastructure.
Pro Tip: Track cost and groundedness on the same dashboard panel. The two metrics moving in opposite directions, cost up, groundedness down, is the earliest warning sign of a retrieval pipeline quietly degrading before users start complaining.
How Do You Instrument Traces for LLM Applications?
OpenTelemetry’s GenAI semantic conventions have become the practical default for instrumenting LLM applications, largely because they avoid locking teams into a single vendor’s proprietary format while still giving you a standardized shape for spans across a heterogeneous stack of models, vector databases, and tool integrations.
A trace in this model represents one full user interaction, and it decomposes into spans for each discrete operation: the retrieval call, the model generation, each tool invocation. What you capture per span determines whether that trace is actually useful six months from now when you’re debugging a regression. A workable per-span attribute set includes:
Model name and version, since silent model swaps are a common cause of unexplained quality shifts.
Generation parameters: temperature, top_p, max tokens.
Input and output token counts and computed cost.
Retrieval query text, retrieved document IDs, and similarity scores, so groundedness can be measured against what was actually retrieved rather than assumed.
Tool-call arguments and results, captured verbatim where privacy rules allow.
Span timestamps and parent IDs, so the full causal chain reconstructs cleanly.
That retrieval detail matters more than it looks. Instrumenting explicit retrieval spans with document IDs and similarity scores lets you measure groundedness deterministically instead of guessing whether a hallucination came from the model or from bad context.
On the proxy versus SDK question, there’s a real tradeoff. A proxy sitting in front of your model calls captures traffic with minimal code changes and works across languages, but it typically only sees the request and response, not the internal application logic that produced the prompt. An SDK integrated directly into your application code captures richer context, business logic, user session state, upstream data sources, at the cost of instrumenting each service individually. Most production teams end up running both: a proxy for broad coverage and cost tracking, SDK-level tracing for the handful of critical flows where root-cause detail actually matters.
Retention is a cost decision disguised as an engineering one. Full trace payloads, especially with retrieved documents and tool outputs attached, get expensive fast at scale. A common pattern is full-fidelity retention for seven to fourteen days, with aggregated metrics and a sampled set of traces (particularly ones flagged by evaluators) kept indefinitely for regression testing.
How Do You Evaluate LLM Output Quality at Scale?
No single metric captures whether an LLM response is good, which is why modern evaluation practice mixes reference-based and reference-free metrics rather than betting on one scoring method.
Reference-based metrics compare output against a known-good answer: BERTScore and ROUGE fall here, useful when you have a labeled dataset but brittle when correct answers can be phrased many valid ways. Reference-free metrics judge output on its own merits, perplexity, QA-based consistency checks, and don’t require ground truth, which makes them cheaper to run continuously but harder to trust in isolation.
LLM-as-judge techniques have become the workhorse for evaluating open-ended generation at scale, and several distinct approaches have emerged:
G-Eval: a chain-of-thought scoring approach where a judge model reasons through evaluation criteria before assigning a score.
RTS (rate-then-score) and MCQ-style scoring: structured formats that constrain the judge’s output to reduce variance.
H2H (head-to-head) comparison: pitting two candidate outputs against each other rather than scoring each in isolation, often more reliable than absolute scoring.
The catch is that LLM judges carry their own biases: positional bias favors whichever answer appears first, verbosity bias rewards longer responses regardless of quality, and self-enhancement bias means a judge model tends to rate outputs from its own model family more favorably. Calibration techniques, including MEC (multi-evaluator consensus), BPC (bias-corrected pairwise comparison), and structured human-in-the-loop review, exist specifically to correct for these tendencies rather than trusting a single judge score at face value.
A well-built evaluation suite treats datasets, metrics, and methodology as three separate design decisions that need to run continuously against production traffic, not as a one-time benchmark run before launch. Connecting these eval scores directly to your alerting system, rather than reviewing them in a weekly report, is what turns evaluation from a compliance exercise into an operational safeguard. For teams weighing which evaluator setup fits their traffic pattern, a closer look at how automated judges hold up against human validation is worth reading before committing to a single approach.
Your Implementation Checklist: From Zero to Operational
Getting from “we should probably monitor this” to a working observability pipeline follows a fairly consistent sequence across teams we’ve observed, regardless of industry.
Define goals and SLAs first. Map each metric family, computational, semantic, agentic, to a specific service-level target before writing any instrumentation code. A support bot might target p95 latency under three seconds and groundedness above 90%; a research agent might tolerate slower responses but need a hard cap on tool-call loops.
Choose your instrumentation approach. Decide proxy versus SDK versus both, based on the proxy/SDK tradeoffs above, and standardize on OpenTelemetry’s GenAI conventions so you’re not locked into a single vendor’s schema. Build PII redaction into the instrumentation layer itself, not as a downstream cleanup step, since prompts and tool arguments often contain customer data.
Decide storage and retention policy up front. Full trace fidelity for a short window, aggregated metrics long term, and a sampled or flagged subset retained for regression testing. Get this wrong and you’ll either blow your storage budget or lose the exact traces you need six months later.
Build dashboards around the three metric families, not a single undifferentiated wall of charts. Layer anomaly detection on top so a groundedness dip or a cost spike triggers investigation before a customer notices.
Set alert severity rules deliberately. A latency SLA breach might page an on-call engineer; a single hallucinated response might just log to a review queue. Treating every anomaly as a page-worthy incident trains teams to ignore alerts entirely.
Build cost accounting and token attribution into the pipeline, tied to the trace, not reconstructed later from a billing invoice. Attribution at the task level, not the API call level, is what actually connects observability data to a defensible ROI conversation with finance.
Add runtime guardrails, output filters, PII scrubbers, and confidence thresholds that can block or fall back to a safer response, before a risky output reaches a user, not as a post-incident patch.
Operationalize the feedback loop. Write runbooks for common failure signatures, connect flagged evaluation failures to your incident response process, and route recurring failure patterns back into prompt revisions or fine-tuning datasets rather than letting them pile up in a dashboard nobody reviews.
Pro Tip: Skip step six and you’ll find out your agent workflow costs three times what you budgeted, from a finance team’s spreadsheet, weeks after launch, not from your own dashboard.
BRDGIT’s Perspective: Observability as Part of the Delivery Roadmap
Observability is often treated as an afterthought bolted onto a finished AI system. That sequencing is backward. Observability belongs in the assessment phase, right alongside defining what the AI system is supposed to do, because the metrics you choose upfront shape what “working” even means for that specific workflow.
The most common mistake we see is teams instrumenting computational metrics thoroughly, latency, cost, uptime, while leaving semantic quality almost entirely unmonitored. It’s understandable: latency dashboards are familiar territory, groundedness scoring is not. But a fast, cheap system that quietly gives wrong answers is worse than a slow one that’s honest about its limits.
A close second mistake: building elaborate dashboards with no alerting logic connected to them, so quality regressions get discovered by a customer complaint rather than a triggered review.
Instrument the semantic layer from day one, not as a phase two addition.
Connect evaluation scores to alerts before launch, not after the first incident.
Treat cost attribution as a launch requirement, not a finance team surprise.
Specialized, time-boxed work like standing up an OpenTelemetry-based tracing pipeline, wiring evaluation scores into alert thresholds, and building dashboards that map to business risks can be more efficient than hiring full-time staff, and getting it built correctly the first time is important.
Connecting LLM Observability to Existing MLOps Platforms
Most engineering teams already run an MLOps stack, model registries, feature stores, CI/CD pipelines for retraining, built for classical ML. LLM observability doesn’t replace that infrastructure; it plugs into it as an additional signal source, though the integration points differ from what traditional model monitoring expects.
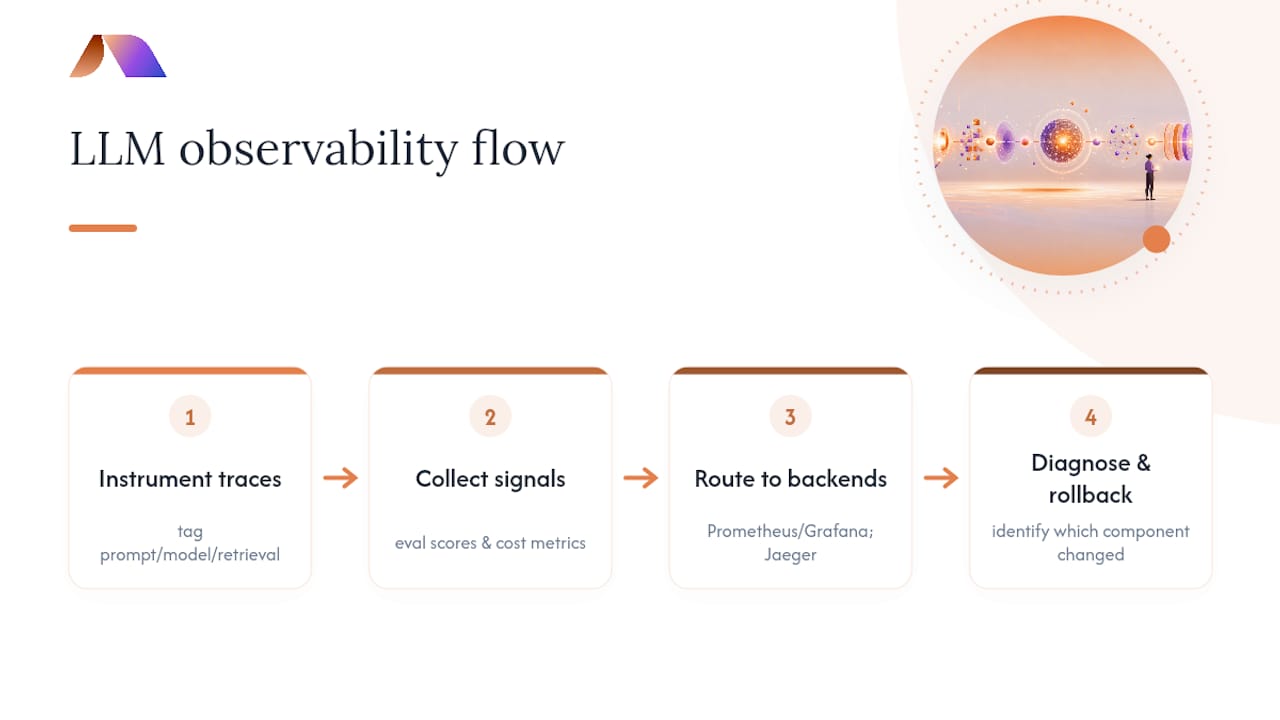
Where classical ML monitoring watches for feature drift and prediction distribution shifts, LLM observability watches for prompt drift, retrieval quality degradation, and semantic score trends over time. The practical integration pattern is to route evaluation scores and cost metrics into the same time-series backend your infrastructure team already uses, Prometheus and Grafana are common choices, alongside distributed tracing backends like Jaeger for the trace-level detail. That keeps LLM signals visible on the same dashboards as everything else rather than living in a separate, siloed tool nobody checks.
Where it diverges from classical MLOps is versioning and rollback. A traditional model rollback is a binary swap; an LLM rollback might mean reverting a prompt template, a retrieval index, or a model version independently, and your observability layer needs to distinguish which of those three changed when a quality metric shifts. Tag every trace with prompt version, model version, and retrieval index version separately, so a regression investigation doesn’t require guessing which component changed. Teams that skip this tagging discipline end up re-deploying old prompt versions blind, hoping it fixes a regression they can’t actually localize.
Data Privacy and Compliance in LLM Observability
Traces are, by design, detailed records of what users asked and what the model retrieved and returned. That makes an observability pipeline a compliance surface, not just an engineering tool, and it needs to be treated that way from the instrumentation stage rather than retrofitted after a privacy review flags it.
Prompts and tool-call arguments routinely contain customer names, account details, or other sensitive information. Two practical patterns handle this: redact PII at the instrumentation layer before it’s ever written to a trace store, and apply role-based access control to raw trace data so only engineers actively debugging an incident can see unredacted payloads. Aggregated metrics and evaluation scores can stay broadly accessible; raw prompt and response content should not.
Retention policy is a compliance decision as much as a cost one. If your traces contain personal data, your retention window needs to align with whatever data protection obligations apply to your business, not just what’s convenient for debugging. This is also where audit logging earns its keep: being able to show exactly which prompts and retrievals led to a specific decision is increasingly a real requirement, not a nice-to-have, particularly for regulated industries. Teams building GDPR-relevant audit trails around AI decisions should look at documenting per-decision audit logs for LLM data protection impact assessments, since a well-instrumented trace store is most of what a DPIA process actually asks for.
Managing Model Updates and Versioning in Your Observability Setup
Model providers push updates on their own schedule, and a silent model version bump behind an API endpoint is one of the most common causes of an unexplained quality regression that no one on the team can immediately diagnose.
The fix is straightforward in principle and easy to skip under deadline pressure: tag every trace with the exact model version, prompt template version, and any relevant configuration parameters active at generation time. When groundedness or relevance scores shift, that tagging lets you filter traces by version and see immediately whether the regression correlates with a model update, a prompt change, or something else entirely.
Version comparison is where evaluation and observability overlap most directly. Before rolling out a new model version broadly, route a percentage of traffic to it in shadow mode, run your evaluation suite against both the old and new version’s outputs on the same inputs, and compare semantic scores side by side. This catches regressions before they reach full production traffic instead of after a spike in user complaints.
Keep a versioned changelog that ties each prompt or model change to the evaluation results that justified shipping it. Six months later, when someone asks why the current prompt template looks the way it does, that changelog is the difference between an evidence-based answer and a shrug.
Real-World Patterns in LLM Observability Implementation
The teams that get LLM observability right tend to share a specific pattern: they treat the trace, not the aggregate dashboard, as the primary debugging artifact, and they build evaluation into the deployment pipeline rather than running it as a separate audit exercise.
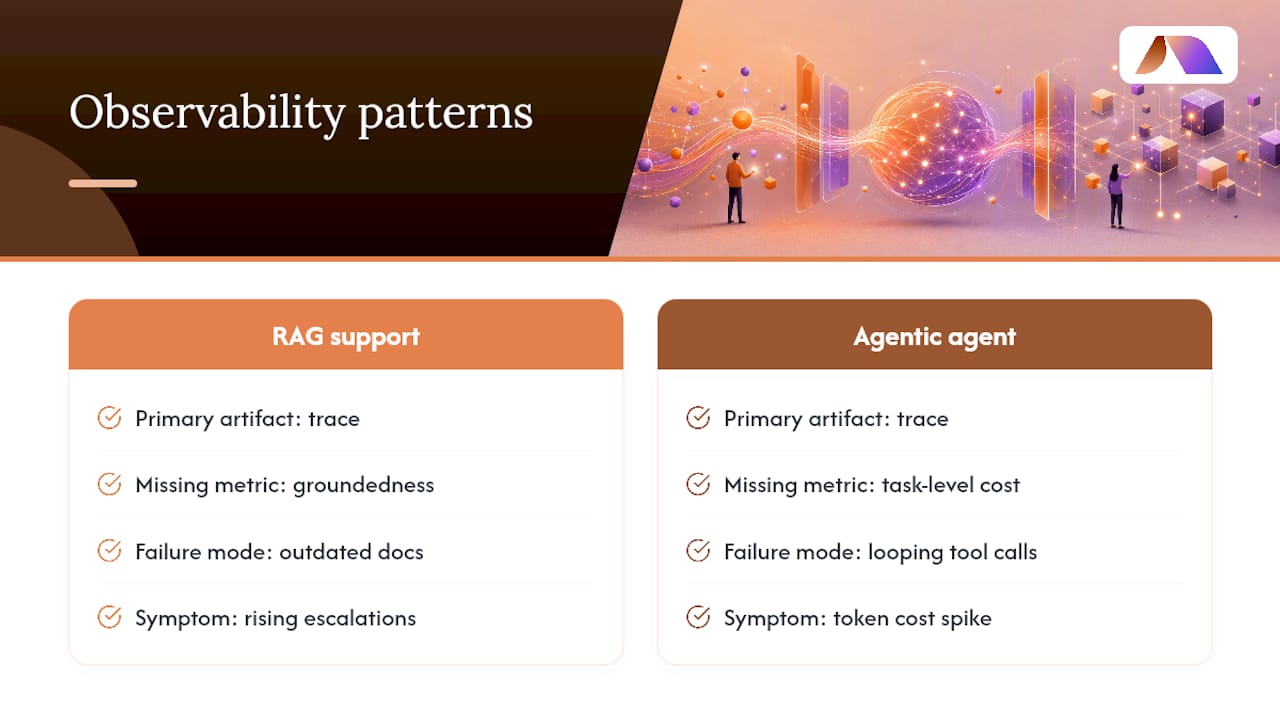
A customer support deployment is a common illustration. A team ships a RAG-based support bot, instruments computational metrics from day one, and initially skips semantic scoring to hit a launch deadline. Within weeks, escalation rates to human agents climb without any corresponding latency or error spike, the kind of drift that’s invisible to conventional APM. Adding groundedness scoring after the fact reveals the retrieval index was returning outdated documentation after a product update, a fix that traditional monitoring would never have surfaced because nothing about the system was technically “broken.”
A second common pattern shows up in agentic workflows. A multi-step research agent passes every unit test in isolation but occasionally loops between two tool calls in production, quietly multiplying token cost for a small percentage of sessions. Task-level cost tracking, rather than per-call tracking, is what surfaces this, because per-call metrics look completely normal while the task-level total quietly balloons. Both patterns point to the same underlying lesson: the metrics teams choose to watch often aren’t the ones that actually predict failure, and observability only pays off when it’s built around the failure modes specific to how the system is actually used, not a generic dashboard template.
The Engineer’s Take: What Actually Matters Here
Most advice on this topic front-loads dashboards and back-loads evaluation, and that ordering is backward. A dashboard without a calibrated evaluator behind it just displays numbers nobody trusts. Start with the trace as your unit of truth, instrument it against OpenTelemetry’s GenAI conventions so it isn’t locked to one vendor, and only then build the visualization layer on top.
The overrated piece is chasing a perfect automatic evaluator. None exists, and every LLM-as-judge approach carries measurable bias. The underrated piece is the alert-to-guardrail connection: an evaluation score that never triggers an action is just an expensive log entry.
If you’re starting from zero, sequence it this way: instrument traces first, connect a basic automatic evaluator second, wire that evaluator to at least one runtime guardrail third. Dashboards come after those three exist, not before. Teams that reverse this order build impressive-looking monitoring for a system whose actual failures they still can’t explain.
— Team BRDGIT
Sources
For teams implementing this directly, the primary specs are worth reading in full rather than secondhand. Start with OpenTelemetry’s GenAI semantic conventions for instrumentation, NVIDIA’s inference metrics documentation for precise computational definitions, and the Microsoft evaluation metrics playbook for evaluator selection and calibration guidance.
List of eval metrics for working with LLMs — Microsoft Learn
Practical evaluation framework for LLM-reliant systems — arXiv (2025)